by Cliff Clark
I've probably worked with or advised a couple of dozen traders over the last couple of years. The ones I am going to speak of in this article, and it's most of them, all have a small problem or set of problems in common. I'll go over those problems here in hopes that it will help those of you that may be having similar problems.
The group of people I am speaking of are the people that have taken PTS (or some other formal trading education course) and have or are currently working on a trading plan. Most have at least four months of trading experience. The other group of people that I won't address in this article are the ones that haven't gotten a formal education or haven't developed a trading plan. When I hear from those folks I usually tell them that I will be happy to help them once they have taken a course and learned to read the charts. It's hard to help you if you haven't gotten an education.
I mainly see three different problems over and over. I will present them here in no particular order.
Information overload: This problem is usually holding traders back in their first six months after completing PTS. The trader typically completes the course and tries to write a trading plan around the whole course. They try to learn every pattern all at once. This probably can't be done except perhaps by the geniuses among us.
Potential Fix: For this problem I normally suggest that they select one strategy to trade. I ask that they write a trading plan around that one strategy and start trading it with small risk. How does this help? It allows the trader to learn every nuance of that pattern. Over time they can increase their risk. Once they become an expert at that pattern they can add another, etc. I think for most this will reduce the information overload and help with the stress level while trading.
No pre-trade checklist: People ask me almost daily why I think they have such a low batting average and can't seem to get it up. They ask me if it could be the market or some other such thing. They are perplexed as to why they can't get the batting average up. I often here from people with batting averages below 30%. That is no exaggeration. When your batting average is that low it's not the market, trust me.
Potential Fix: My first question is, do you have a pre-trade checklist? Would you believe the answer is “no”, 80-90% of the time. Adding a pre-trade checklist to your daily routine is my suggested fix. This fix isn't going to get you any additional winners but it will keep you out of a lot of bad trades. In almost every case when I hear back from a trader that implemented the checklist, the batting average has come up significantly. Some turned from losing or break even trader to profitable trader almost immediately. A lot of those were guys that had been trading for a year or more. Who would have thought that something as simple as a pre-trade checklist could have saved you a year of more worth of loses. Think about it, if you don't have a pre-trade checklist get to work on it today.
Too High Risk Level: A lot of guys I hear from have been trading for awhile and are fairly adept at reading charts. They complain that they constantly break their plans and never really feel comfortable while they are in a trade. The problem almost always stems from having too high of a risk level. For some reason, guys that have been trading for a year or more somehow feel entitled to be trading with high risk. They contend that they feel like they are experts at reading the charts and they should be able to handle that risk level. The problem with this argument is that the streets are littered with broke traders that are expert chart readers. It's not about how good you are at reading a chart it's about how good you are at making money. You have to learn how to manage risk or all that expertise in chart reading is meaningless.
Potential Fix: If you want to stop breaking your plan lower your risk, plain and simple. I don't care how long you have been trading or how great your chart reading skills are. Lower it all the way back to $10 if you have too, or at least to a level where you think you can sit in the trade without breaking your plan. Once you are comfortable at that level move to the next level. Over a few months you should be able to work back up to a level where you are making nice profits.
I'll bet most of you that have been trading for some time and aren't making money are missing one or more of the above issues. These are simple fixes that can turn you around in a hurry. If you implement them and they work for you let me know, I'd love to hear about your success!
2 trades for me today with +1.5R total
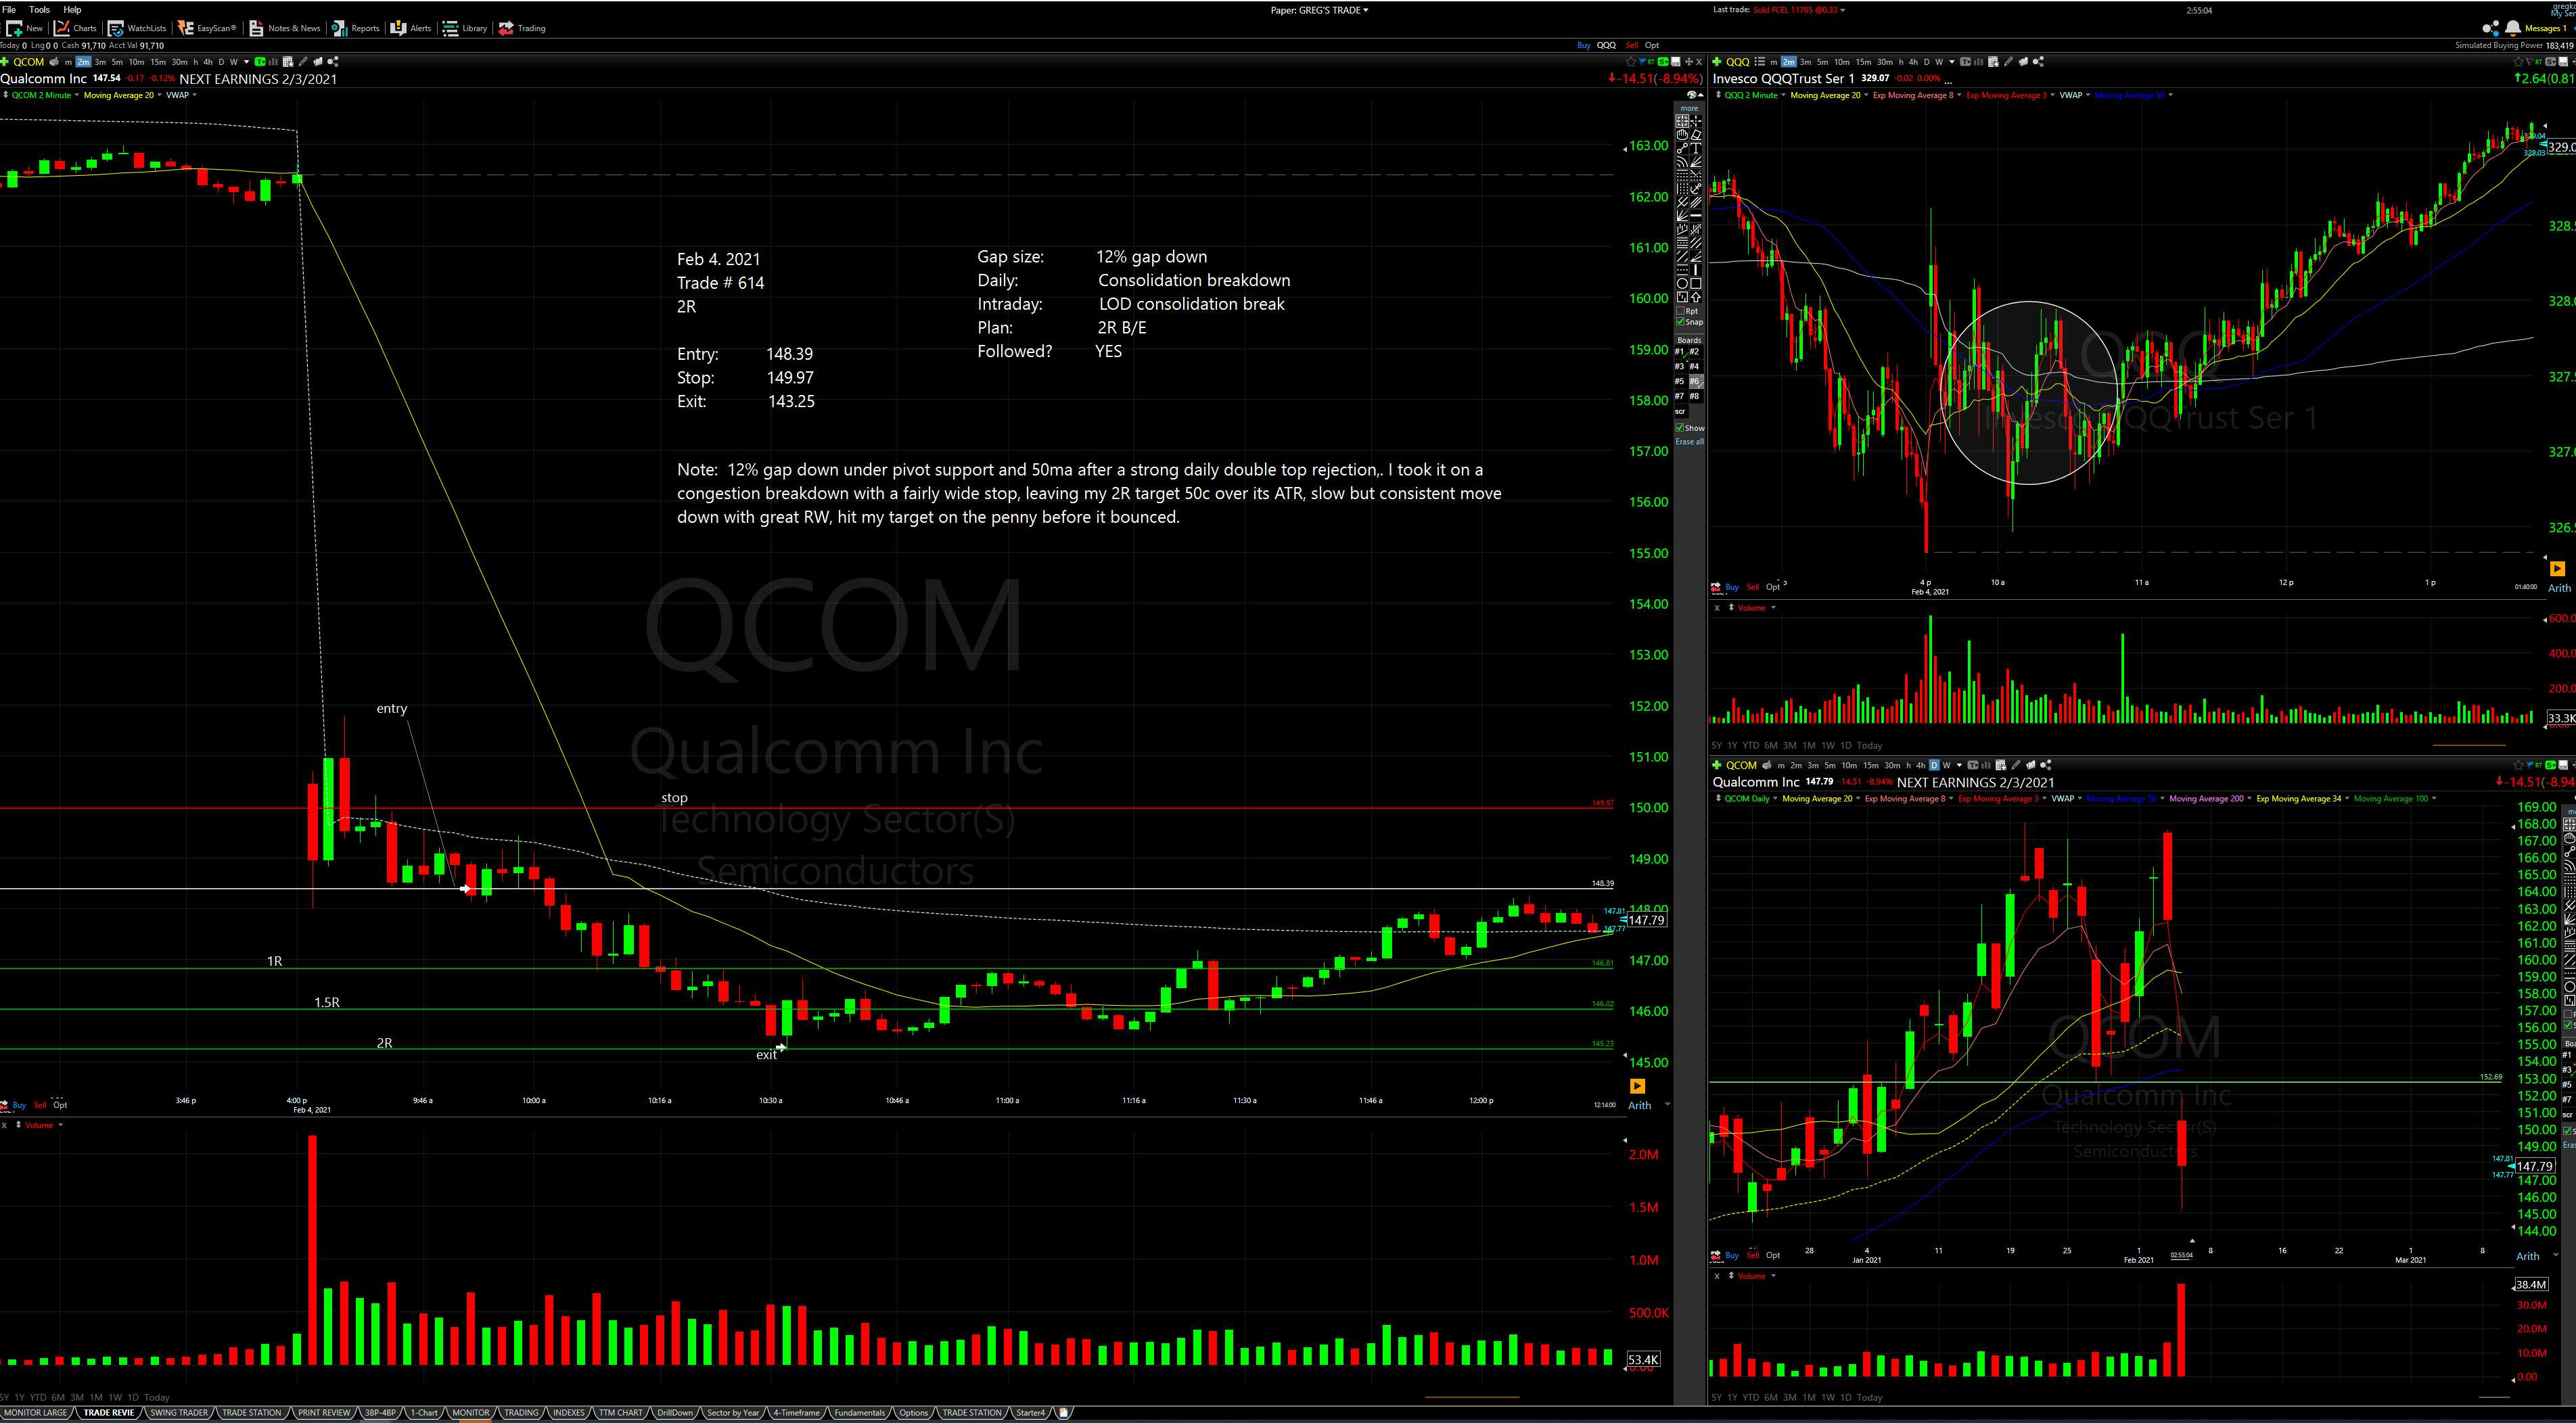
1st Trade QCOM +2R
148.39/149.97 exit 143.25
12% gap down under pivot support and 50ma after a strong daily double top rejection,. I took it on a congestion breakdown with a fairly wide stop, leaving my 2R target 50c over its ATR, slow but consistent move down with great RW, hit my target on the penny before it bounced.
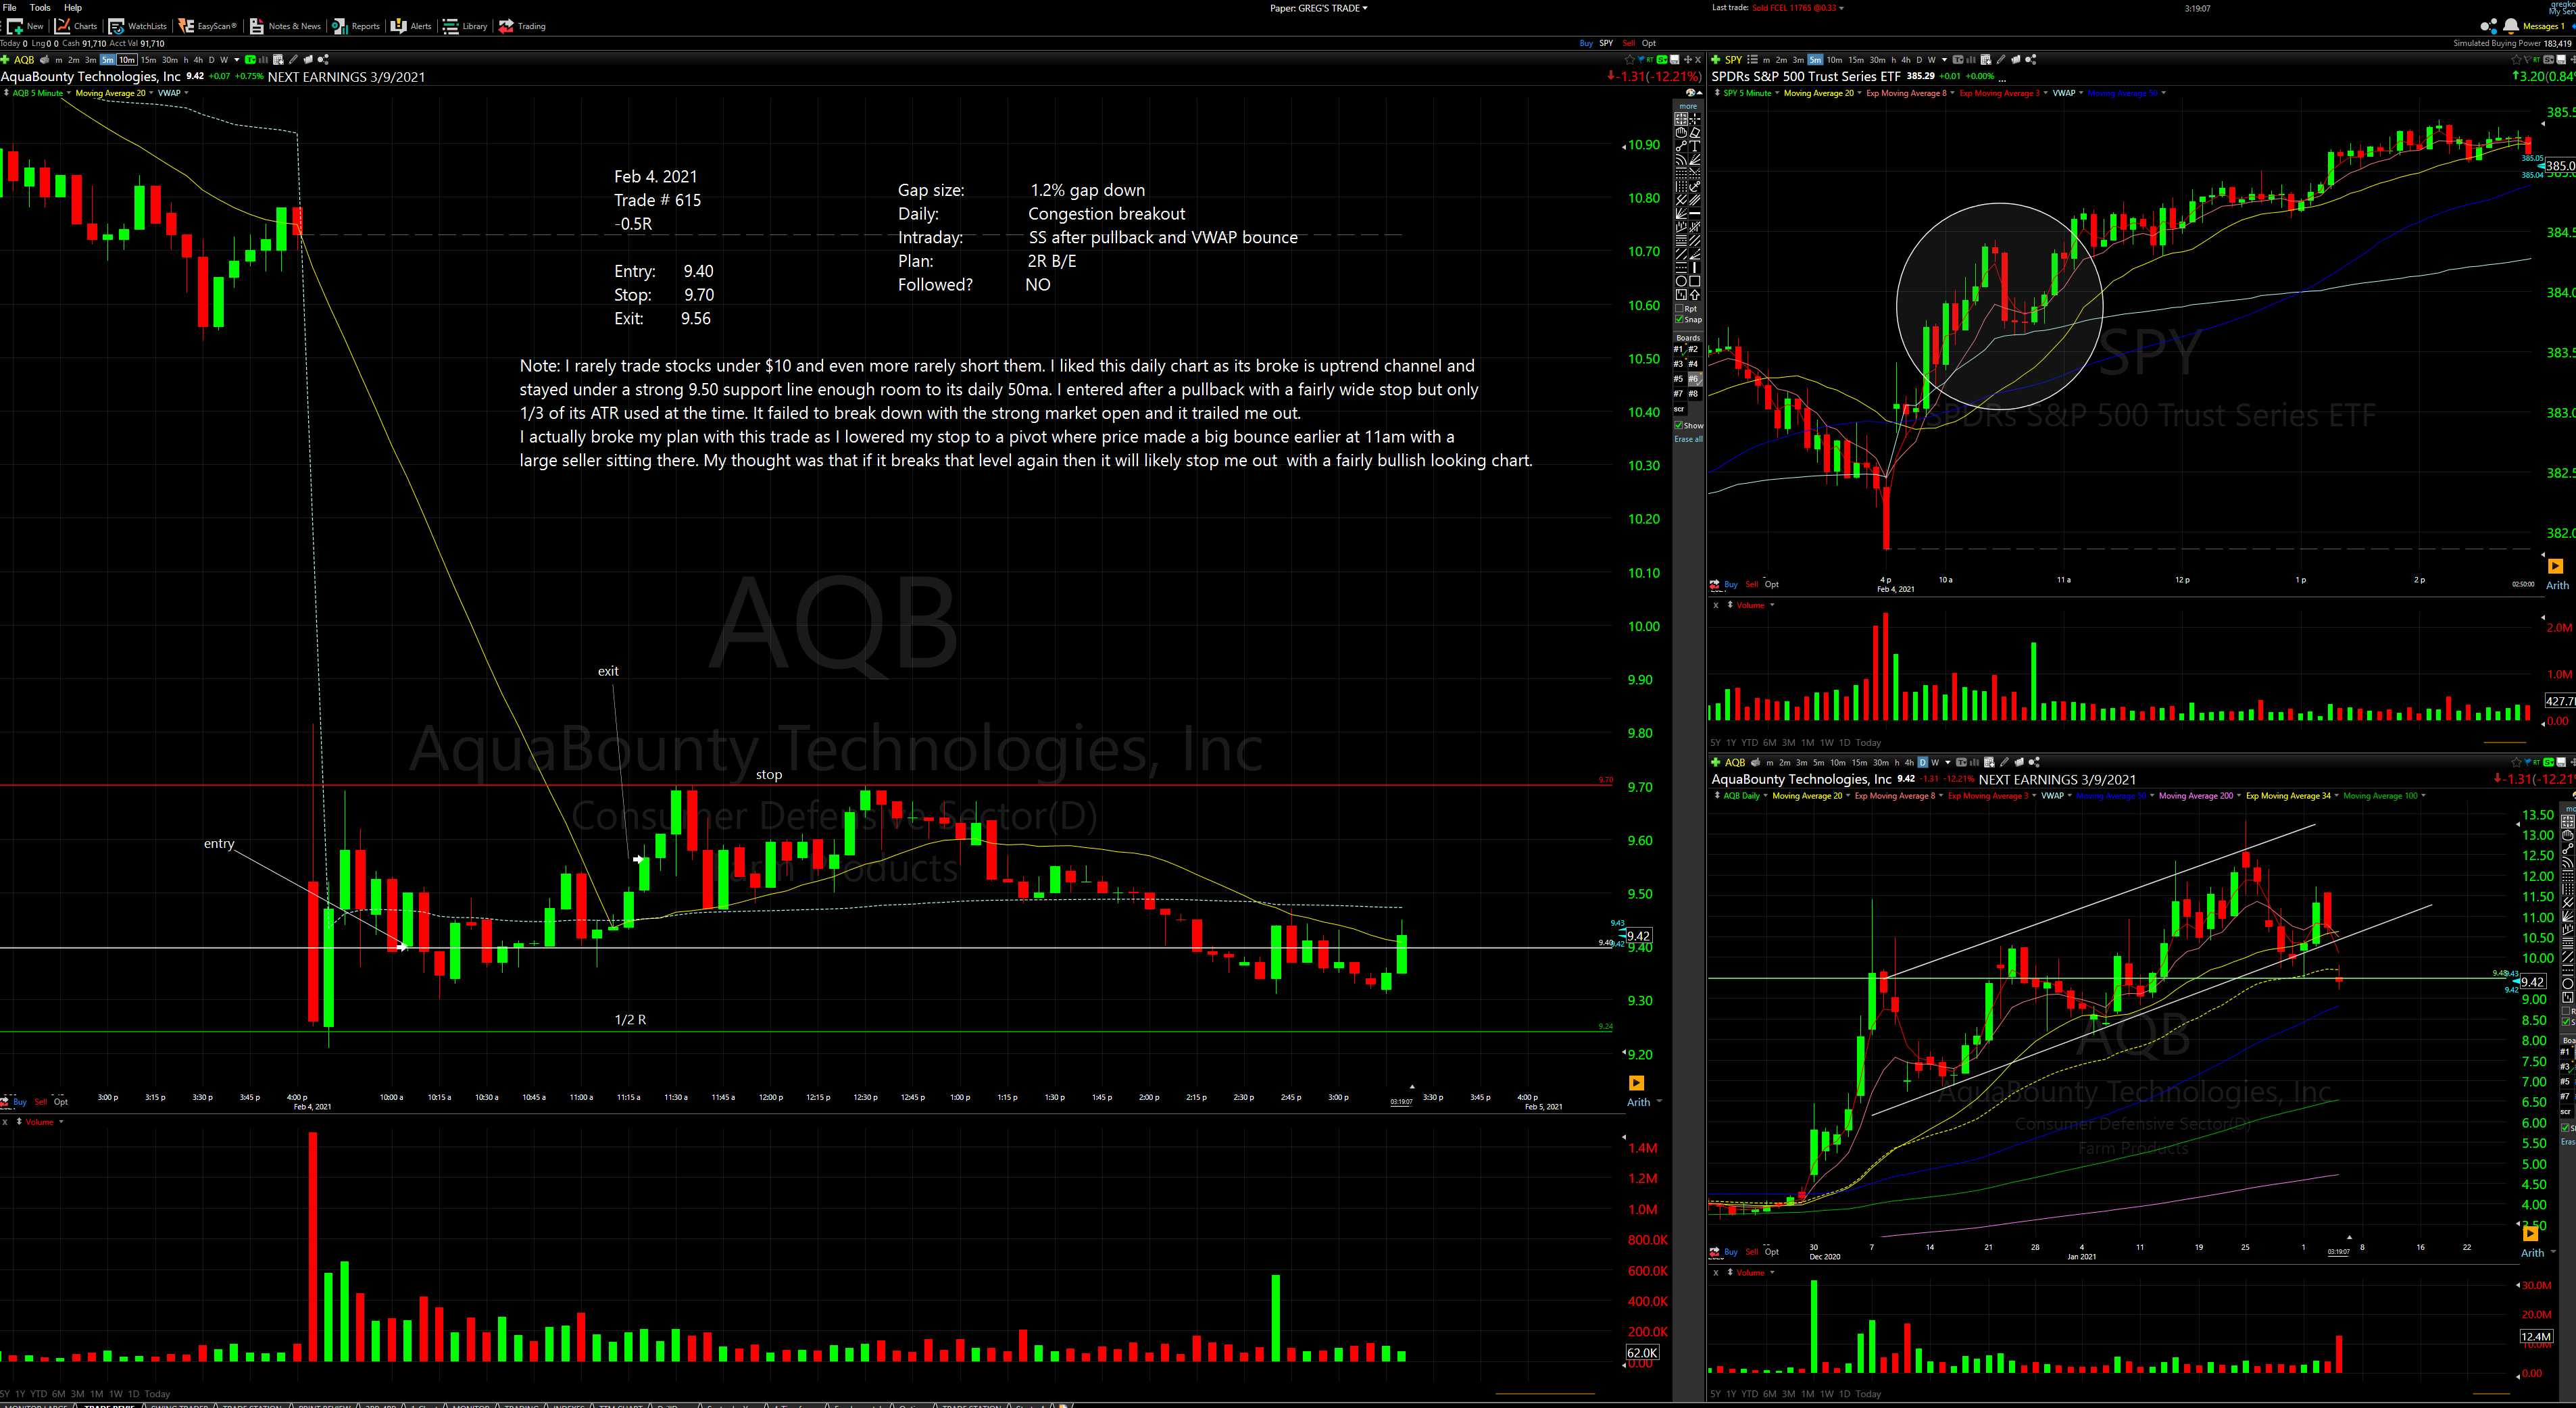
2nd Trade AQB -0.5R
9.40/9.70 exit 9.56
I rarely trade stocks under $10 and even more rarely short them. I liked this daily chart as it broke its uptrend channel and stayed under a strong 9.50 support line enough room to its daily 50ma. I entered after a pullback with a fairly wide stop but only 1/3 of its ATR used at the time. It failed to break down with the strong market open and stayed in a narrow range.
I actually broke my plan with this trade as I lowered my stop to a pivot where price made a big bounce earlier at 11am with a large seller sitting there. My thought was that if it breaks that level again then it will likely...
1 trade for (-1R)
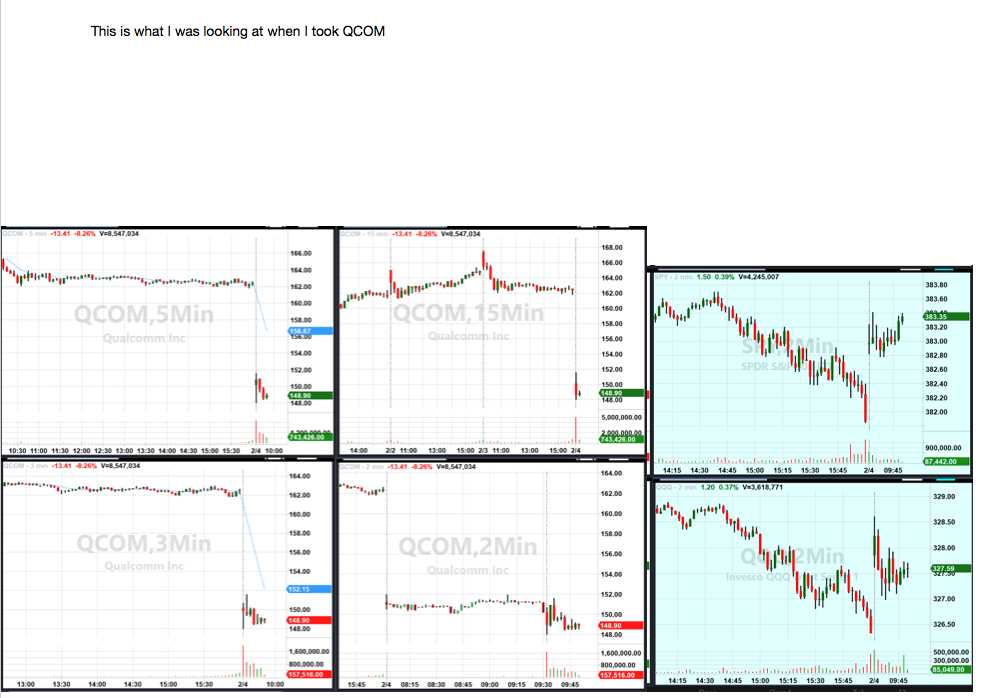
I took a BD on QCOM. I was worried about the target being close to the daily range, so I took a tighter stop on the 2 min chart. I am looking through PTS right now, most of the examples have 2 options for where to put your stop. It looks to me like one of the stops would be at the bottom of the main consolidation area, and the other at the bottom of where there has been a shakeout or turnaround bar (if there has been one). Due to the daily range I took the tighter one on this. In hindsight it seems obvious to take the wider stop, but in the moment it looked ok.
I was then looking at the 15 min 3BP on QCOM, but the reason I used a tighter stop in the first place was because of the range. The 15 min 3BP would have needed to have gone even further than the wider stop on the 2 min BD, so I didn't take it.